Author: Frederick R. Vobbe, W8HDU
November 18, 2008
| Understanding The Smith Chart Author: Frederick R. Vobbe, W8HDU November 18, 2008 |
 The Smith Chart was created by an RF engineer at R.C.A. labs by the name of Phillip Smith. In my younger days I was told that Carl Smith, of the consulting engineering firm Smith Electronics, Cleveland, Ohio, was the inventor. It was't until about twenty years ago when I started researching the chart did I find the truth. Carl was an expert in AM directional antennas. The Smith Chart was created by an RF engineer at R.C.A. labs by the name of Phillip Smith. In my younger days I was told that Carl Smith, of the consulting engineering firm Smith Electronics, Cleveland, Ohio, was the inventor. It was't until about twenty years ago when I started researching the chart did I find the truth. Carl was an expert in AM directional antennas.
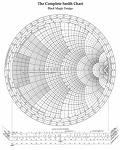
As a side note, I have great admiration for Carl E. Smith. I was working at a radio station in 1968 and was watching him tune a six tower array that was slightly askew. My part, and that of others, were to run the radials of the station and report signal readings. As I was watching Carl I mused, "how do you know what coil to change to make the change in the field?" Carl looked at me, told the other guys to go take lunch, and I received a lesson in antenna design, the Smith Chart, and antenna phasers from "the master". So in a way, I owe my livelyhood to Carl. If you browse the Internet you'll also find references to a Japanese engineer named Kurakawa who also created a chart like the Smith Chart about a year before. Regardless of who invented it, it's a great visual method for calculating RF networks and seeing what the outcome may be. If you click on the picture of the chart above, you'll get a PDF that you can download and print. However you can also find web sites where you can buy the paper already printed. Now that you have read the fluff, let's get into the meat of the Smith Chart. Transmission lines have a characteristic impedance, or Zo, that is the square root of the inductance/meter divided by the square root of the capacitance per meter of the cable. For example, RG-8 coax is 52.0 ohms. But why chart it? We normall look at impedance as values of resistance and reactance. Resistance and reactance represent an opposition to series connected circuits where impedances add together. But, many circuits have elements connected in parallel or "shunt" that are the acceptance value of admittance (Y) and its constituent values of conductance (G) and susceptance (B), where Y=G+jB. Keep in mind that B=jwC for a capacitor, and B=1/jwL for an inductor. Admittances add together for shunt-connected circuits. Remember that Y=1/Z=1/(R+jX), so that G=1/R only if X=0, and B=-1/X only if R=0.  Ideally, you want your RF network to be right in the middle of the chart. To the left and you start to drop the resistance until it becomes a dead short. To the right and you increase resistance to a point where it's an open circuit. To the top you're adding an inductive load, and to the bottom it's more capacitive. Let's look at one antenna, and the differences in the chart.  The red circle is where I want to be. This would indicate a 50-ohm load with little reactance or capacitance. The antenna is a Cushcraft A3S that I'm rebuilding. I'm taking eight measurements across the 20 meter band. I'm using an AntennaX analyzer (MFJ calls these their Model 259B). I'm reading eight frequencies in the Phone portion of the band. Note that we start off inductive, and a few ohms low, and finish up on the capacitive side and the impedance slips up a few ohms. Now, let's install a W2AU 1:1 balun on the antenna instead of feeding it directly with 50-ohm coax.  Note that in this chart I used the 2nd to the 7th frequencies, but compare the results to the previous chart we had larger swings in resistance and reactance. You can see how the Smith Chart helps visually to determine patterns in RF networks. In this case, the grouping you see of the six frequencies across the 20 meter phone band is very acceptable to my Yaesu FT-857D. In this case I don't need a tuner, while in the other case (feeding the antenna with one section of RG-8, no balun), I had just enough variations in the reactance and resistance to cause VSWR trips on the rig. So the Smith Chart tells me, I improved my antenna system. References A good article, in PDF, is one by Rick Nelson, Senior Technical Editor, Test & Measurement World, July 2001. It's titled "How does a Smith chart work?" Another good article is an application note by Maxim called, "Impedance Matching and the Smith Chart: The Fundamentals". And you can find a third good article on Connections, titled "Simple Calculations with the Smith Chart" by Bill Wilson. Frederick R. Vobbe, W8HDU |
 |
© Copyright 2008 All Rights Reserved - W8HDU |